
yeast, blowfish, platypus, acrylic on wood panel, pen on wood panel, 60×60(cm), 2016, with KyungWon Choi
rat, chimpanzee, human, acrylic on wood panel, pen on wood panel, 60×60(cm), 2016, with KyungWon Choi
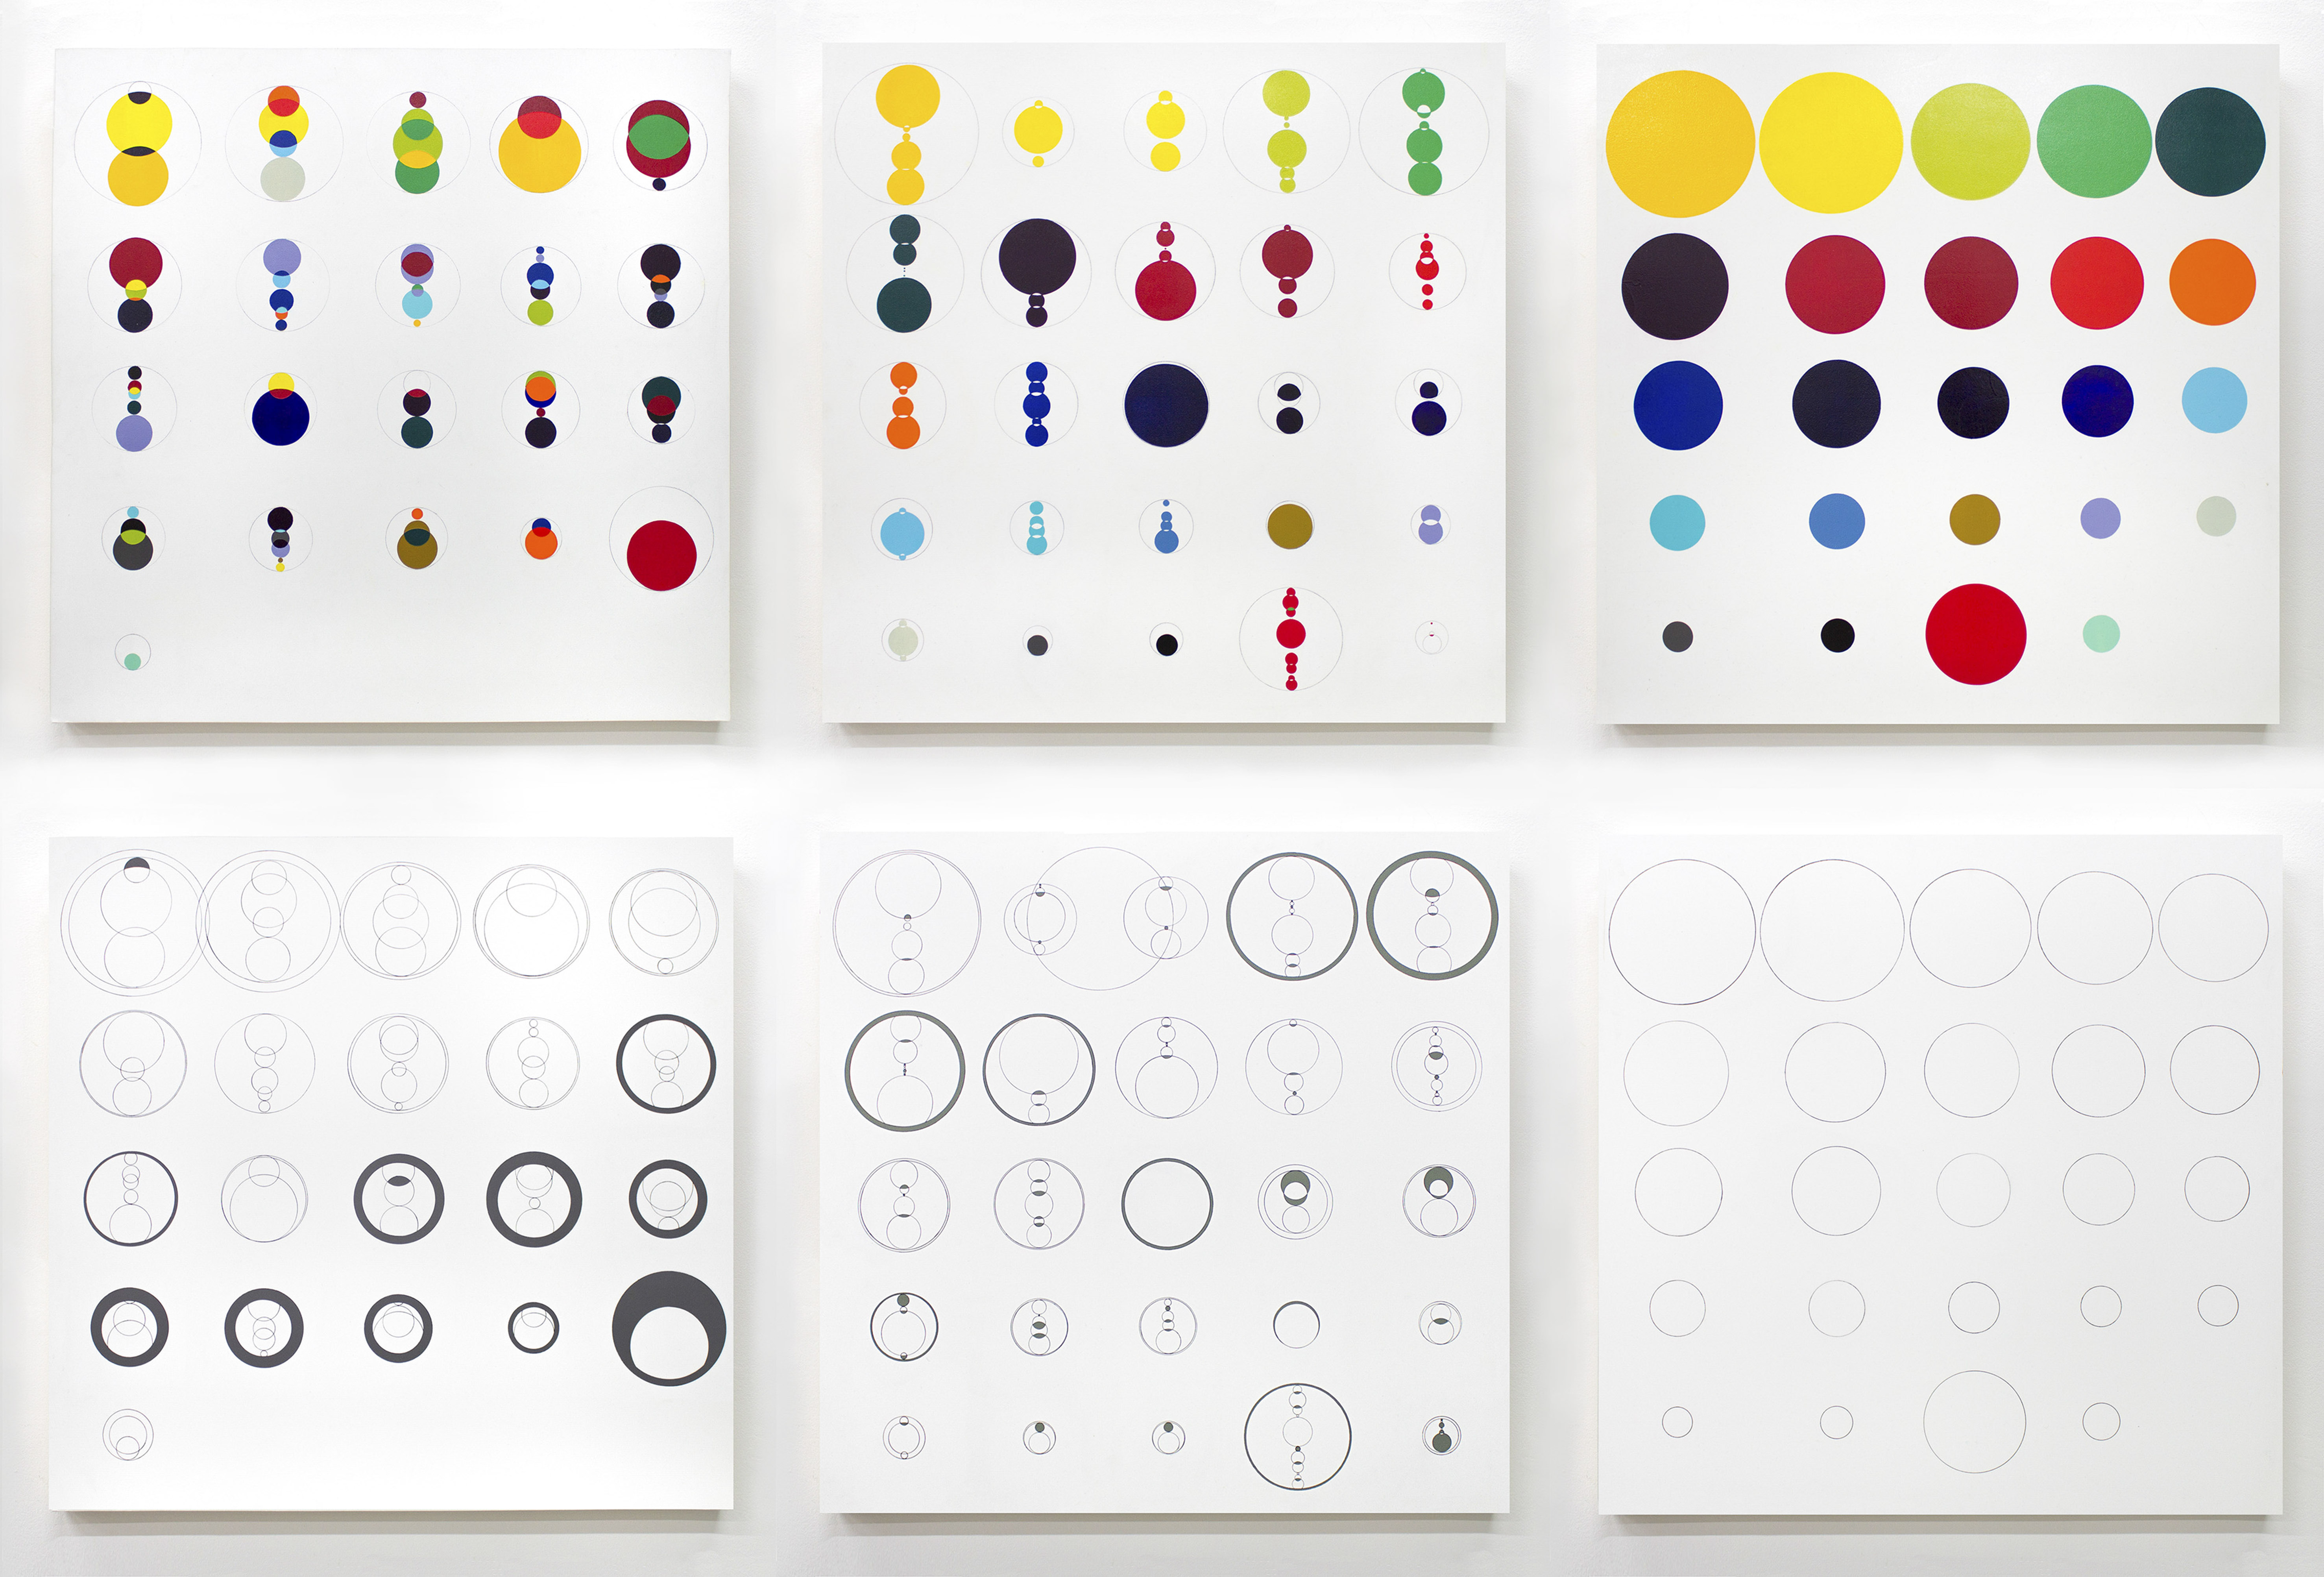
Paintings indicate six species’ chromosomes. The human chromosome, which is designated as a criterion, manifests differences and similarities from other species by substituting chromosomes’ quantity, data value(MB), and AGCT rate by quantity, form, color CMYK, and arrangement.
Statement of DNA Project
This project that began with the simple question, “Why are humans human?” has led me to study the biological building blocks that compose a human being. When you open up a map of the human genome and look at the billions of sequences that make up the AGCT, you see a sequence map that resembles the photographs of Becher and Gursky. A sequence map that is completely devoid of individuality paradoxically characterizes species.
In this work, the big data of the human genome is simplified into colors, sizes, numbers, and arrangements to create an intuitive visualization of the similarities and differences between different species. The genetic approach shows how various forms or characteristics of an organism are passed on to its offspring and how they manifest in each individual. Through genetic information, I acknowledge the inherent differences between organisms and imagine the stages of their evolution. Starting with yeast and ending with pufferfish, platypus, rat, chimpanzee, and human, 6 of the 12 paintings are represented by 24 colors (22+XY) based on the human chromosome, and the remaining 6 are represented by replacing the AGCT ratio with CMKY to express differences. The number of chromosomes and data value (MB) of each individual are converted into circles and ratios to represent the information. By specifying the species based on the sequence of genes and data values that humans possess, similarities and differences can be seen. The six solid-colored dots represent the genes that are unique to the species.
Only monkeys and humans can touch their thumbs together, and some believe this subtle difference has led to the development of civilizations and changes in thought. The subtle differences also show up in the genome map, where about 99% of human genes are very similar to those of mice, and 80% are identical, with a one-to-one correspondence. Monkeys and humans are 98% identical, and even yeast’s genes are similar to ours. It’s interesting to note that these 1-2% differences have changed species. What makes humans human is probably due to this 1-2% difference. I hope viewers consider it through 12 paintings.
